 | | Book | | and the Indian Geological Congress. Dr. Haldar is recipient of “Dr. J. Coggin Brown Memorial (Gold Medal)...to Mineralogy and Petrology, 2014, Elsevier. Dr. Haldar has a unique professional blend of mineral...born hills appear parallel to Mahagiri range due to mine-waste dumping. Unpaved roads serve the movement...The sky is gloomy throughout the day due to the mine and road dust. Social evils, crime, alcoholism,...education, counseling, and training. Making stringent mine-safety rules is not the solution—it has to be implemented | 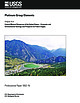 | | Report (issue) | | gov/images/periodictable.pdf. Cover. Stillwater Mine in south-central Montana, looking southeast. The...Methods......................................N39 Mine Waste Characteristics.........................................................................N42 Mine Closure...........................................sulfide ore exposed in a stope in the Oktyabr’sk Mine in the Talnakh area, Russia.......................N15 Photograph of the UG2 Chromitite at the Karee Mine in the western part of the Bushveld Complex, South |  | | Report (volume) | | of Documents. ANCHORAGE, Alaska--4230 University Dr., Rm. 101 ANCHORAGE, Alaska--605 West 4th Ave., Rm...Virginia--National Center, Rm. 1C402, 12201 Sunrise Valley Dr. SALT LAKE CITY, Utah--Federal Bldg., Rm. 8105,125...based on considerations that extend far beyond the mine itself, in some instances relating to the overall...subject, as in a scale model of the workings of a mine, to a unifying concept that explains or describes...government believed might someday be economic ta mine. Stratiform deposits of large areal extent, such | 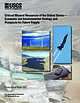 | | Report (issue) | | .B3 Graph showing dates associated with all the mine sites on the U.S. Environmental Protection Agency’s...production, U.S. apparent consumption, and U.S. mine production of antimony from 1900 to 2012............................F2 Graph showing world cobalt mine and refinery production and apparent consumption.....................F2 Graph showing world cobalt mine production from 1950 to 2011......................F4. Pie chart showing percentage of world cobalt mine production in 2011, by country................. |
|


