Ferrokinoshitalite : (Ba,K)(Fe2+,Mg)3(Al2Si2O10)(OH,F)2
How to use the mindat.org media viewer
Click/touch this help panel to close it.
Welcome to the mindat.org media viewer. Here is a quick guide to some of the options available to you. Different controls are available depending on the type of media being shown (photo, video, animation, 3d image)
Controls - all media types
Zoom in and out of media using your mousewheel or with a two-finger 'resize' action on a touch device.
Use the mouse or your finger to drag the image or the view area of the image around the screen.
< and > at the left and right hand side of the screen move forwards and backwards for the other images associated with the media you selected. Usually this is used for previous/next photo in a gallery, in an article or in search results. Keyboard shortcuts: use shift + the left and right arrow keys.
< and > in the bottom center are used for switching between the photos of the same specimen. Keyboard shortcuts: use the left and right arrow keys.
> in the bottom center, raises the information box giving details and further options for the media, < at the top of this box then hides it. Keyboard shortcuts: use the up and down arrow keys.
? opens this help window. Keyboard shortcuts: use the H key or the ? key.
Other keyboard shortcuts:
| 1 | Fit image to screen |
| 2 | Fill screen with image |
| 5 | Display at full resolution |
| < | Make background darker |
| > | Make background lighter |
| space | Hide/dim titles and buttons |
Scalebar
If the field of view (FOV) is specified for the photo, the scalebar appears in the left bottom corner of the viewer. The scalebar is draggable and resizeable. Drag the right edge to resize it. Double click will reset the scalebar to it's default size and position. If the scalebar is in default position, double click will make it circular.
Controls - Video
Video files have a standard set of video controls:  - Reset to start,
  - Skip back,
  - Play,
  - Pause,
  - Skip forwards. Keyboard shortcuts: You can stop/start video play with the P key.
Controls - Animation (Spin Rotation)
Animation (usually 360 degree spin rotations) have their own controls:  - enable spin mode. Note that while images are loading this option will not be available but will be automatically activated when the animation has loaded. Once active you can spin the image/change the animation by moving your mouse or finger on the image left/right or by pressing the [ or ] keys.
The  button switches to move mode so that you can use your mouse/fingers to move the image around the screen as with other media types.
The button, or the P key will start playing the animation directly, you can interrupt this by using the mouse or finger on the image to regain manual movement control.
Controls - 3D Stereoscopic images
If a stereoscopic 3D image is opened in the viewer, the 3D button appears in the bottom right corner giving access to "3D settings" menu.
The 3D images can be viewed in several ways:
- without any special equipment using cross-eyed or parallel-eyed method
- with stereoscope
- with anaglyph glasses.
- on a suitable 3D TV or monitor (passive 3D system)
For details about 3D refer to: Mindat manuals: Mindat Media Viewer: 3D
To enable/disable 3D stereo display of a compatible stereo pair image press the 3 key. If the left/right images are reversed on your display (this often happens in full-screen mode) press the 4 key to reverse them.
Controls - photo comparison mode
If a photo with activated comparison mode is opened in the viewer, the
 button appears in the bottom right corner giving access to "Comparison mode settings" menu.
Several layouts are supported: slider and side by-side comparison with up to 6 photos shown synchronously on the screen. On each of the compared photos a view selector is placed, e.g.: Longwave UV ▼. It shows the name of currently selected view and allows to select a view for each placeholder.
Summary of all keyboard shortcuts
| 1 | Fit image to screen |
| 2 | Fill screen with image |
| 3 | Switch to 3D display of stereo pair |
| 4 | Switch left/right images in 3D mode |
| 5 | Display at full resolution |
| <, > | Make background darker/lighter |
| H or ? | Show/hide this help page |
| P | Play/Pause Video or Animation |
| [, ] | Backwards/forwards one frame (Animation only) |
| space | Hide/dim titles and buttons |
| up arrow | Show information box |
| down arrow | Hide information box |
| left arrow | Previous child photo |
| right arrow | Next child photo |
| shift + left arrow | Previous image on the page |
| shift + right arrow | Next image on the page |


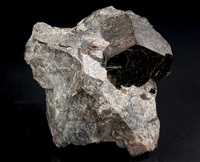


As noted under the parent photo, both the material from Sterling Mine and this sample from the Buckwheat Dump have substantial Zn. They also have substantial Cl, although the amount in the Buckwheat material is less than at Sterling Hill. If the Zn is interpreted as a hendrickite “component”, I estimate that the Sterling Hill ferrokinoshitalite is about 1/9th hendricksite and that the Buckwheat material is (very roughly) about 1/3 hendricksite.
The ideal formula for hendricksite is K(Zn,Mg,Mn2+)3(AlSi3O10)(OH)2, so based on the near equality of the peak heights of K and Ba in the scan for the Buckwheat material, one might guess that the material is really borderline ferrokinoshitalite-hendricksite. However, based on scans for other minerals, it appears that Ba is somewhat less readily detected than K with the equipment used. So probably Ba is actually > K.
A better way to look at this may be the following:
According to [http://www.handbookofmineralogy.com/pdfs/hendricksite.pdf], two probes of Franklin hendricksite both produced empirical formulae with K ~= Mn and almost no Ba. On the other hand, neither the type locality ferrokinoshitalite nor the Sterling Hill sample have significant Mn. So if we assume that almost all of the Mn in the Buckwheat scan is coming from a hendricksite “component”, then a roughly equal part of the K must also be attributed to this component. The remaining K is almost certainly less than the Ba, even if Ba and K are equally well detected (which is probably not the case). So the other mica “component” is actually quite similar to the type material ferrokinoshitalite (for which the Ba:K ratio is about 1.4).
In a nutshell, the arguement is this: The presence of Zn implies the presence of a hendricksite component. Even if the amounts of K and Ba are equal (as implied by a simplistic interpretation of the peak hights), there is no way that hendricksite component, whose K content has to be roughly the same as its Mn componet, can be as large as the Ba carrying component - i.e. the ferrokinoshitalite. Since hendricksite has very little Ba, the only way that this material could be "hendricksite dominant" would be for all of the K to belong to that component. But all know examples of ferrokinoshitalite have substantial amounts of K.
Here is another way to see this: Published probes of hendricksite show almost no Ba, so the Ba in the Buckwheat scan must belong to the ferrokinoshitalite "component". But TL ferrokinoshitalite has very little Mn, so that must belong mostly to the hendricksite "component". In the Buckwheat sac, the ratio of Ba to Mn peak heights (as measured from the noise floor) is about 2.6. Even if all of the Mn in the scan is attributed to hendricksite, in order for the specimen to be hendricksite dominant, Ba would have to be more that 2.6 times readiliy detected than Mn. Based on scans of other, "known" minerals I could believe a ratio of 1.5 or perhaps even 2.0 - but not greater than 2.6. (Recall that in the pupblished hendricksite probes Mn ~= K. So effectively the formula might be written as KMn(K(Zn,Mg)2(AlSi3O10)(OH)2. Of course that is not the structural formula.)
Yet another way to see this is to compare the Mn and Fe peak heights in the scan. Almost all off the Mn has to be coming from the hendricksite and most of the Fe from the ferrokinoshitalite. Fe and Mn are detected roughly equally, so the material must be ferrokinoshitalite dominant. In more detail: The Fe/O ratio in the empirical ferrokinoshitalite formula is 1.72/10. The Mn/O ratio averages to 0.89/10 in hendricksite and there is also an average Fe/O of 0.24/10. If you set this up as a system of two equations in two unknowns, it comes out that the hendricksite component is about 37%.
The caveat here is that the above “analysis” is based on a “quick and dirty”, qualitative EDS scan in conjunction with empirical formulas from just a few probes. To be certain, a microprobe would be required. I wouldn’t put any money on that 37% estimate!
As for how the “components” express themselves physically, I can offer no guidance. According to Tracy, the Sterling Hill material (unlike the Ba-rich micas from Lime Crest) exhibited only grain-to-grain chemical variations, but not chemical zoning within a single grain.
This photo has been shown 82 times